This website uses cookies so that we can provide you with the best user experience possible. Cookie information is stored in your browser and performs functions such as recognising you when you return to our website and helping our team to understand which sections of the website you find most interesting and useful.
pip install 3lc for free to try our beta

Steps to try the 3LC beta
Put our platform through its paces and experience 3LC for yourself. All we ask is that you provide us feedback and help us stay focused on the right priorities to make 3LC better. Here’s are the steps:
1
pip install 3lc
pip install 3LC to get started with the Object Service and launch the dashboard
2
Start the Object Service
The 3LC Object Service enables sharing of samples and metrics across 3LC components, including notebooks and the Dashboard, and must be started from the terminal to use 3LC.
3
Launch 3LC Dashboard
Launch the 3LC Dashboard to explore your data. Let your model tell you how to improve your data, and restart training without needing to export or rewrite anything.
Visit our documentation page for more insight and detailed steps on our Quickstart page.
Provide Honest Feedback
We want to hear about your experience. What worked, what could be improved, and what didn’t you like? Your feedback will shape the future of 3LC. Provide it at any point during the Beta by visiting our Discord page.
Our Latest Features
We’re excited to announce the release of 3LC Dashboard version 2.5.1! This update enables users to experience 3LC without the need for installation, optimizes rendering performance settings based on the users GPU profile, and allows for the creation of custom label categories.
What’s New in the Dashboard 2.5.1 release:
New Demo Dashboard
Experience the 3LC Dashboard with our newly launched stand-alone demo version, link here. With the demo Dashboard, you can experience the insights provided by 3LC using example datasets, all without requiring any additional installation.

Render performance settings tailored to your hardware
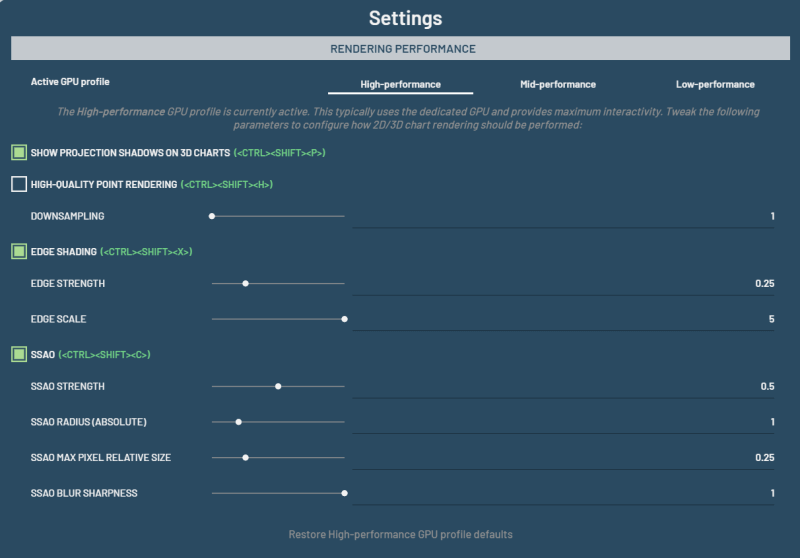
3LC now enhances your experience by automatically detecting your GPU profile and adjusting rendering performance settings for optimal 2D/3D chart visualization. The settings dynamically adapt to the type of GPU your browser uses and adjust in real-time, even when your laptop switches to battery power. You can also manually adjust these settings to suit your preferences.

New Value Map Creation
You can now create custom label categories such as shown in the below example where we have added a quality column to enable rating a sample as exceptional, great, good, or bad.

Stay tuned for future updates and try the new release today! Read the full release notes at 3LC Dashboard Version 2.5.1.
Diver deeper into your data
Light up the black box and pip install 3LC to gain the clarity you need to make meaningful changes to your models in moments. Remove the guesswork from your model training and iterate fast.
No sign-up required. Get started now or book a meeting to learn more.