
Streamlined Workflows
with 3LC
-
Dian He
Traditional and common Machine Learning workflows are in need of an overhaul. With no visibility into what’s going wrong, indication of what to fix, and months invested for marginal gains, we need a better approach. Introducing 3LC.

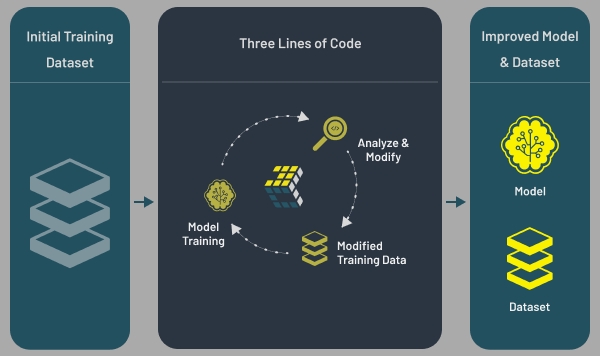
How 3LC streamlines data science workflows:
training, analysis, revision and re-training
The common ML workflow is broken. Training an initial model, analyzing the results, revising data and re-training is long-winded and often pointless.
With no visibility into what’s going wrong, no clear indication on how to fix it, and months wasted waiting for marginal gains (if any), there has to be a smarter way.
This was the precise thinking behind 3LC, a unique platform that transforms machine learning (ML) from a ‘black box’ process into an open, interactive experience.
In this article, I walkthrough how 3LC is accelerating and condensing steps while empowering users to find issues and fix them in-place to deliver huge performance gains.
Unparalleled insight into models and data
3LC offers data scientists unparalleled control and deep insight into their models and the key model-data interactions. By improving the fitness and relevance of datasets and enhancing the efficiency of model training, 3LC provides a substantial competitive edge in today’s data-driven business environment.
The common ML workflow of training, analyzing results, revising, and re-training on revised data is seamlessly integrated in 3LC. You don’t need to worry about transferring and duplicating your data across various platforms and constantly changing your training scripts anymore.
3LC takes care of all the tedious parts to allow you to 100% focus on your main tasks – enhancing your data and improving your model.

Easy to use and quick to train
Using 3LC begins in your notebook or Python script. With minor modifications to code required to incorporate the 3LC python package, your data and training results are neatly collected and shared between your code and the 3LC Dashboard.
Our dashboard is the beautiful frontend where you will spend most of your time interacting with your data and training results. Powerful functionality in the Dashboard–including plotting, filtering, sorting, searching, and adding more derivative data via Virtual Columns–gives you full control on how you want to play with your data.
You no longer need to spend a big chunk of your time writing scripts to extract useful information from a sea of data to get insights from it. All of this can be done directly in the dashboard.
Once you have made changes to your dataset, there is no need to manually download, export, or re-factor your code. Simply re-run your code, and 3LC will automatically use the revised dataset, collect new metrics, and allow you to compare the results against previous runs and iteratively improve your model and dataset.
The product in action
Let’s walk you through the workflow: training, result analysis, data revision, and re-training, with a case study on Cifar-10 dataset.
Worth adding at this juncture that 3LC is designed to tackle the more advanced challenges with data that don’t imply human labeling errors. However, for this walkthrough, we want to show you a simple example of how it works.
To mimic real world problems and demonstrate how we efficiently find erroneous samples and edit them in 3LC, we did some modifications on the original Cifar-10 dataset. 2500 random samples in the training set (5%) were selected and their original labels were altered with incorrect random labels.
1. Training
Training in 3LC is no different from training anywhere you may have experienced. All we need is to add a few lines of code–such as the 3LC dataset and the metrics collector–so the metrics are collected and seamlessly displayed in the 3LC Dashboard and the training script automatically picks up the label revisions for retraining.
Here is a snippet of how we wrap up the PyTorch dataset in a 3LC Table format.

You can directly use any of the built-in metrics in PyTorch or define your own metrics in a function and wrap it up into a 3LC metrics collector as below.

For this case study, we trained ResNet-18 with no pretrained model for 5 epochs. Metrics are collected during every epoch.
2. Result analysis
Training results are collected in Runs. In this Cifar-10 Run (flush-patio), we collected a variety of metrics including Cross Entropy Loss, Accuracy, RMSE, MAE, and Embedding, etc.
You can plot 2D or 3D charts on any collected metrics. The sample images can also be displayed in the Charts area. In the screenshot, we plotted a 2D chart on RMSE vs Cross Entropy Loss, colorized by Label.

Initial training Run, flush-patio, on the modified Cifar-10 dataset is displayed in 3LC Dashboard
Filters and selection tools (e.g., lasso) on Charts are powerful tools that allow you to filter and slice through the data to quickly find the data points that you are interested in.
In the screenshot below, we selected the training set and used the lasso tool to select the data points in the upper right corner of the RMSE vs Loss chart. Those data points represent the samples with highest Cross Entropy Loss and RMSE, indicating many have potentially incorrect labels.
By scrolling through those data points, you will find many indeed are incorrectly labeled but correctly predicted by the model. The next step is to edit these labels.

Lasso selected data points in the upper right corner of the RMSE vs Loss chart are active and the rest of the data points are grayed out. The highlighted row of Example ID 1031 is one of the filtered-in data points and shows an automobile image that is incorrectly labeled as a bird.
3. Data revision
Data revision is simple in 3LC. You either manually edit labels on individual samples or apply batch assignments, i.e., assigning a set of predictions to labels collectively.
The batch assignment will replace the original labels with the predicted labels only on these filtered-in data points by lasso selection. For this case, 2451 samples in the training set have been re-labeled with their predictions.
Note:batch assignments will inevitably introduce new label errors, but the goal is always to correct more than introduce bad labels.

Before data revision: a few potentially erroneous samples from the lasso selected area

After data revision by batch assignment. The yellow background on the Label column indicates the edits on the table cells.
4. Re-training
Re-training on data revisions in 3LC is seamlessly integrated. You don’t need to move your revised datasets from one place to another and manually modify your scripts every time you have a new revision and want to re-train on it.
Re-training in 3LC can be as simple as how you first trained your datasets. With these two lines of code in the training script, your script will automatically pick up the latest revisions of the datasets when you re-train the model.

After retraining on the revised dataset, we can clearly see the model is improving from the Loss and Accuracy curves. Repeating the process of data revision and re-training a few times will help make better models.

Loss and Accuracy curves of the two Runs (flush-patio=initial Run, ordered-equalizer=re-trained Run) before and after label revision
Want to try it for yourself?
Our Beta program is now open for registrations. If you want to put 3LC through its paces and see how it could save you time, improve your accuracy and help you make better predictions, sign up now. Places are limited and filling fast so don’t miss out.
Sign up for the program at 3LC.ai